SQL EXPLAIN and EXPLAIN ANALYZE: Reading Query Execution Plans for Optimization
Estimated rows versus actual rows is the whole game: reading plans, multiplying by loops, interpreting buffers, and fixing the statistics first.
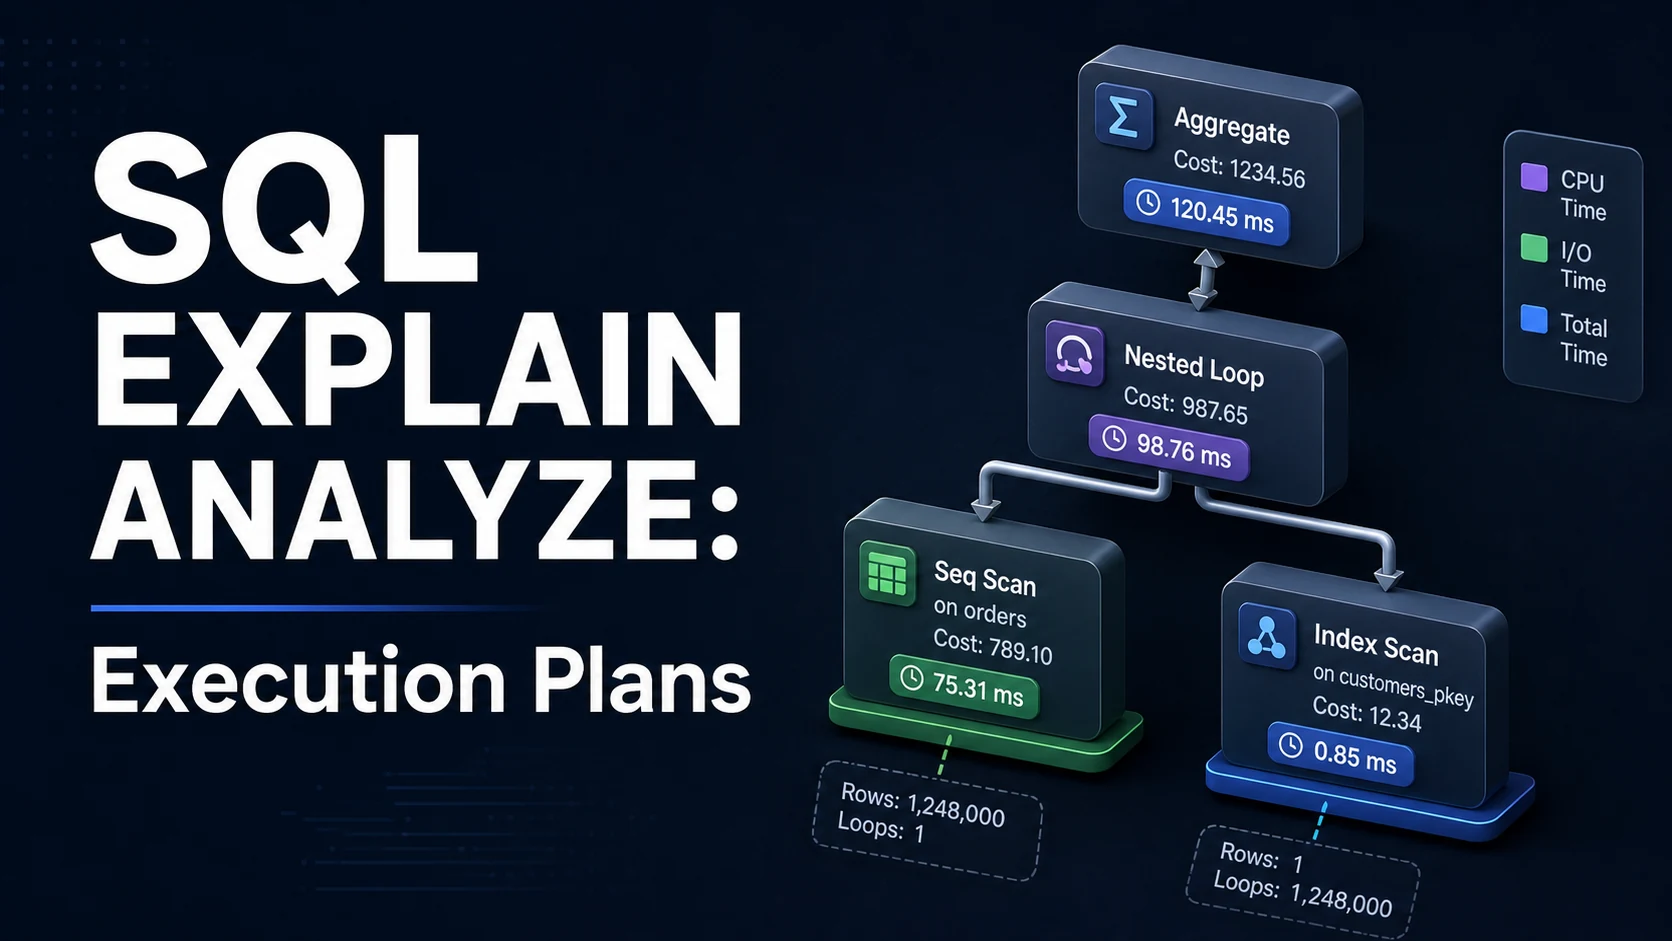
Quick Summary
EXPLAIN shows the plan the optimizer chose and its estimates. EXPLAIN ANALYZE runs the statement and adds what actually happened: real time, real rows, and, with the right option, buffer counts. The gap between the estimate and the actual row count is the most useful signal in the output — a plan that guessed 1 row and read 400,000 chose its join strategy on a lie, and no index tuning fixes that until the estimate is corrected.
Read a plan from the inside out and bottom up: the innermost nodes produce rows, and every node above them consumes. Compare each node's rows estimate against rows actual, then multiply per-loop numbers by loops. Then look at where the time actually is, not at the total cost number, which is an arbitrary unit anchored to seq_page_cost = 1.
The dialects differ in syntax and in how much they tell you. PostgreSQL prints a tree with costs and buffers, MySQL has EXPLAIN plus EXPLAIN ANALYZE since 8.0.18, and SQL Server separates the estimated plan from the actual plan and hides the interesting parts in warnings.
Basic syntax and query signatures
-- PostgreSQL
EXPLAIN SELECT * FROM orders WHERE customer_id = 42;

EXPLAIN (ANALYZE, BUFFERS, VERBOSE, SETTINGS)
SELECT * FROM orders WHERE customer_id = 42;

-- formats: TEXT (default), JSON, YAML, XML
EXPLAIN (ANALYZE, BUFFERS, FORMAT JSON) SELECT ...;

-- safe way to analyze a write
BEGIN;
EXPLAIN (ANALYZE, BUFFERS) UPDATE orders SET status = 'x' WHERE customer_id = 42;
ROLLBACK;-- MySQL
EXPLAIN SELECT * FROM orders WHERE customer_id = 42;
EXPLAIN FORMAT=TREE SELECT ...;
EXPLAIN ANALYZE SELECT ...; -- 8.0.18+, executes the query
EXPLAIN ANALYZE FORMAT=JSON SELECT ...;-- SQL Server
SET STATISTICS IO ON;
SET STATISTICS TIME ON;
SELECT * FROM dbo.Orders WHERE customer_id = 42;
-- or: SET SHOWPLAN_ALL ON (estimated, does not execute)
-- SET STATISTICS XML ON (actual plan as XML)Reading the text output:
Nested Loop  (cost=0.85..1240.10 rows=10 width=64) (actual time=0.05..82.40 rows=12480 loops=1)
  ->  Index Scan using customers_pkey on customers c  (cost=0.43..8.45 rows=1 width=8) (actual time=0.02..0.03 rows=1 loops=1)
  ->  Index Scan using orders_customer_id_idx on orders o  (cost=0.42..1200.00 rows=10 width=60) (actual time=0.02..70.10 rows=12480 loops=1)
        Index Cond: (customer_id = c.id)
Planning Time: 0.312 ms
Execution Time: 84.221 ms
cost=0.85..1240.10 is startup cost then total cost in arbitrary units; rows=10 is the estimate; actual time=0.05..82.40 rows=12480 loops=1 is first-row time, total time, and actual rows for this node. Here the estimate is off by a factor of 1,248 — the planner expected 10 orders for that customer and found 12,480.
Key comparison table
| Output field | Meaning | What to look for |
|---|---|---|
cost=a..b | Estimated startup and total cost | Relative only; not milliseconds |
rows=n (estimate) | Expected rows per loop | Compare with actual |
actual time=a..b | First row, then all rows, in ms, per loop | Multiply by loops for total work |
rows=n (actual) | Real rows produced per loop | Large gaps mean bad statistics |
loops=n | Executions of this node | High loops on a scan is N+1 inside the database |
width=n | Average row width in bytes | Wide rows mean more I/O than the plan suggests |
Buffers: shared hit/read | Pages from cache vs disk | High read on a repeated query is a cache problem |
Sort Method: external merge Disk: 48MB | Sort spilled to disk | Raise work_mem or reduce rows before sorting |
Gather (workers launched: 3) | Parallel workers | Compare worker times against wall clock |
| Engine | Actual plan | Buffers / IO | Notable warnings |
|---|---|---|---|
| PostgreSQL | EXPLAIN (ANALYZE) | BUFFERS (13+) | rows vs actual, disk sort, Heap Fetches |
| MySQL | EXPLAIN ANALYZE (8.0.18+) | EXPLAIN ANALYZE shows per-node rows and time | Using temporary, Using filesort, filtered |
| SQL Server | SET STATISTICS XML ON / SSMS actual plan | SET STATISTICS IO ON | Implicit conversion, spills, missing index |
| Oracle | DBMS_XPLAN.DISPLAY_CURSOR(..., 'ALLSTATS LAST') | LAST shows buffer gets | TABLE ACCESS FULL, stale stats |
| SQLite | EXPLAIN QUERY PLAN | — | SCAN versus SEARCH ... USING INDEX |
Practical edge cases and deep dives
1. A row estimate off by three orders of magnitude
Nested Loop  (cost=0.29..8.31 rows=1 width=16) (actual time=0.03..2140.55 rows=980312 loops=1)
  ->  Seq Scan on orders  (cost=0.00..1.10 rows=1 width=8) (actual time=0.01..0.02 rows=1)
  ->  Index Scan on order_items  (cost=0.29..8.30 rows=1 width=8) (actual time=0.001..1.90 rows=980312 loops=1)
Two things are wrong. The table statistics are stale — a Seq Scan estimating one row on a table with a million rows means ANALYZE has not run since the load. And the join planner picked a nested loop because it believed the outer side had one row. Fix the estimate first:
ANALYZE orders;                                  -- refresh
SELECT attname, n_distinct, correlation FROM pg_stats WHERE tablename = 'orders';
CREATE STATISTICS orders_customer_status (dependencies, ndistinct)
    ON customer_id, status FROM orders;          -- for correlated columns
ANALYZE orders;
Also raise default_statistics_target for skewed columns, and remember that random_page_cost on SSDs is usually set too high, which pushes plans toward sequential scans.
2. EXPLAIN ANALYZE on a write actually writes
EXPLAIN ANALYZE UPDATE ... executes the update and reports what it did. Roll it back inside a transaction — and note that sequence increments (nextval), NOTIFY, and anything done by a VOLATILE function with external effects are not rolled back:
BEGIN;
EXPLAIN (ANALYZE, BUFFERS) DELETE FROM sessions WHERE expires_at < now();
ROLLBACK;
On a production replica, use EXPLAIN (ANALYZE) only on reads. In MySQL, DML inside EXPLAIN ANALYZE has the same effect, and 8.0.20+ supports it on INSERT, UPDATE and DELETE with one caveat: it reports the plan for the write, not the trigger work that follows.
3. Multiplying by loops
-> Index Scan using items_order_id_idx on order_items (actual time=0.02..4.10 rows=8 loops=1500)
That node took 4.10 ms for each of 1,500 executions — roughly 6.2 seconds of the statement's runtime, hidden behind a number that looks like 4 ms. This is the signature of a nested loop where the inner side is not indexed well enough. The remedy is either a better inner index, or a join strategy change that the planner will only pick if the estimates are right (see above), or enable_nestloop = off as a diagnostic, never as a production setting.
The same multiplication applies to parallel plans: worker nodes report loops=3 with three workers, and the parent Gather reports the combined rows with loops=1. Do not add worker times to the top-level execution time; compare them against it.
4. Buffers tell you whether it is the plan or the cache
EXPLAIN (ANALYZE, BUFFERS) SELECT ...;
-- ->  Seq Scan on orders  (actual time=0.02..840.11 rows=2000000 loops=1)
--       Buffers: shared hit=12000 read=88412
88,412 pages read from disk at 8 kB each is roughly 690 MB: the plan is scanning the whole table. If the same query run twice shows only shared hit, the first run was cold cache, and the plan may actually be fine — the slow number was I/O, not CPU. Compare hit plus read (total pages touched) against the table's size in pages to confirm the scan scope:
SELECT relname, relpages, pg_size_pretty(pg_total_relation_size(oid)) FROM pg_class WHERE relname = 'orders';Sort spills are the other buffer signal: Sort Method: external merge Disk: 48MB means the sort exceeded work_mem. Raising work_mem for the session is correct for a reporting query and wrong globally — it is a per-sort limit, and a busy server multiplies it by concurrent sorts.
5. MySQL: rows is an estimate, filtered is a guess
MySQL's EXPLAIN reports rows as an estimate for the whole join, and filtered as the estimated percentage remaining after the condition. Using temporary; Using filesort on a GROUP BY means the server materialised a temp table and sorted it — often fixed by an index on the grouping columns in the right order. EXPLAIN ANALYZE (8.0.18+) replaces estimates with real numbers and shows actual time in milliseconds:
-> Nested loop inner join  (cost=...) (actual time=0.05..210.4 rows=980312 loops=1)
    -> Filter: (o.customer_id = 42)  (actual time=0.03..12.1 rows=12480 loops=1)
EXPLAIN FORMAT=TREE is the readable form; FORMAT=JSON is what to parse when you want to compare plans programmatically.
6. SQL Server: the warnings are the finding
In SSMS the actual execution plan draws a thick arrow where the estimate and actual row counts diverge, and flags the node with a warning triangle. Read those warnings before reading the plan: an implicit conversion (nvarchar parameter compared with a varchar column) forces a scan on a million-row table, and a sort spill means the memory grant was wrong because the estimate was wrong. SET STATISTICS IO ON gives logical reads per table, the number that actually correlates with cost.
Missing-index hints are suggestions, not instructions: they include every column the query touched, and creating all of them makes writes slower. Take the equality and range columns, test the plan, and check sys.dm_db_index_usage_stats for whether the index is used afterwards.
Common mistakes and runtime errors
| Error or symptom | Cause | Fix |
|---|---|---|
Estimated rows=1, actual hundreds of thousands | Stale or missing statistics | ANALYZE, raise the statistics target, add extended statistics |
| Plan looks fine but the query is slow | Time is I/O on first run, or in a trigger | Run twice; check Buffers and trigger timing |
EXPLAIN ANALYZE changed production data | It executes the statement | Wrap in BEGIN; ... ROLLBACK; |
| Node shows 4 ms but the query takes 6 s | loops multiplies the node time | Multiply, then fix the inner index or join order |
external merge Disk in a sort | Sort exceeds work_mem | Raise work_mem for the session, or sort fewer rows |
MySQL says Using temporary; Using filesort | No index supporting GROUP BY/ORDER BY | Add a composite index in the required order |
| SQL Server plan has a yellow warning | Implicit conversion, spill, or missing statistics | Fix types, update statistics, raise memory grant |
EXPLAIN in a function fails | Some engines disallow it in a non-top-level context | Run it separately, or use auto_explain |
| Plan changes between runs | Generic versus custom plan (PostgreSQL), parameter sniffing (SQL Server) | plan_cache_mode, OPTION (RECOMPILE) |
| Index exists but is not used | Function on the column, wrong type, or low selectivity | Rewrite the predicate, add an expression index |
The discipline that pays off is narrow: run the query, read actual rows against estimates, and fix the estimate before changing anything else. Most "add an index" requests are really "the planner does not know how many rows this is", and the index that follows makes the table slower to write without making the query faster to read.
Try matching browser tools
All toolsSmall utilities that fit SQL work — they run entirely in this browser tab, so nothing you paste leaves your device.
Related SQL guides
All SQL guidesSQL Cursors vs Set-Based Operations: Syntax, Memory, and Performance
Why a row-by-row cursor costs minutes where one UPDATE takes seconds, how server cursors spool to disk, and the set-based replacements for each loop.
SQL String Functions: CONCAT, SUBSTRING, REPLACE, and Pattern Matching
The concatenation and slice functions that differ between engines, why LIKE 'x%' uses an index and '%x%' cannot, plus escaping and NULL rules.
SQL Date and Time Functions: INTERVAL Arithmetic, Time Zones, and DST
timestamptz versus timestamp, half-open ranges that keep an index, and the daylight saving gaps that make local scheduling wrong once a year.
SQL Row Locking: SELECT FOR UPDATE, SKIP LOCKED, and NOWAIT
How FOR UPDATE locks rows until commit, why the plan decides the lock scope, and the SKIP LOCKED claim-queue pattern that scales to many workers.
More in SQL
All SQL guidesThe guides filed next to this one in SQL, in library order.