Python guides
Every published Python guide, newest first, with practical examples you can copy into your own project.
3,965 guides across 14 topics
Topics
Popular Python guides
Most read
Latest Python guides
Page 43 of 179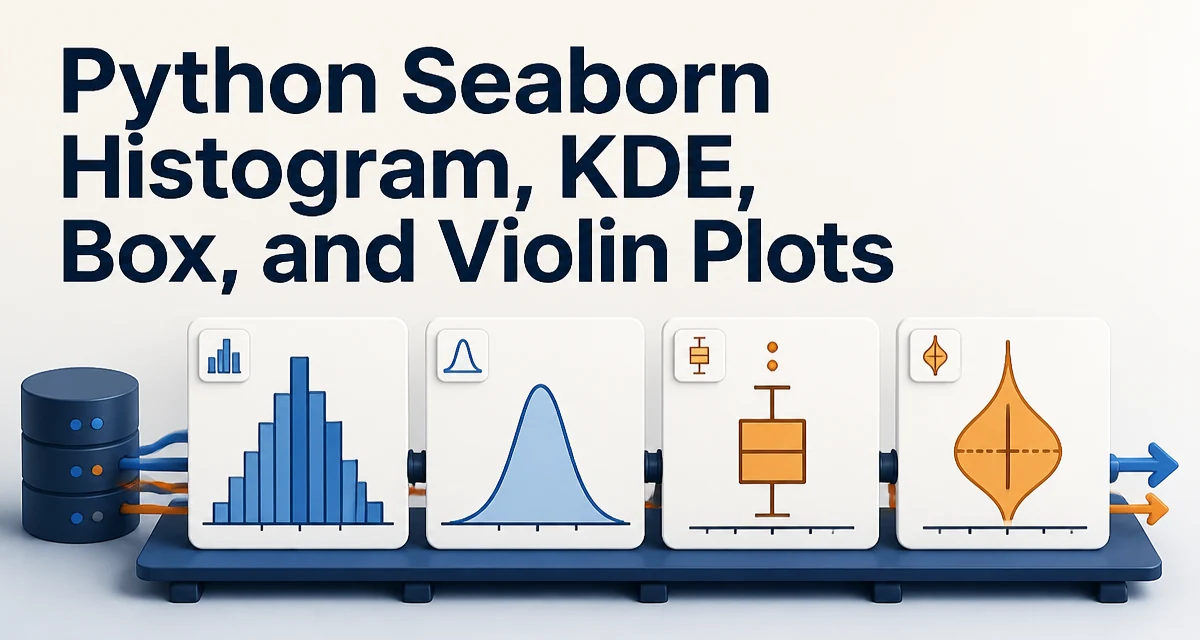
Python Seaborn Histogram, KDE, Box, and Violin Plots
python seaborn histogram kde box and violin plots: Learn to create and interpret seaborn histograms, KDE plots, box plots, and violin plots for effective distribution...
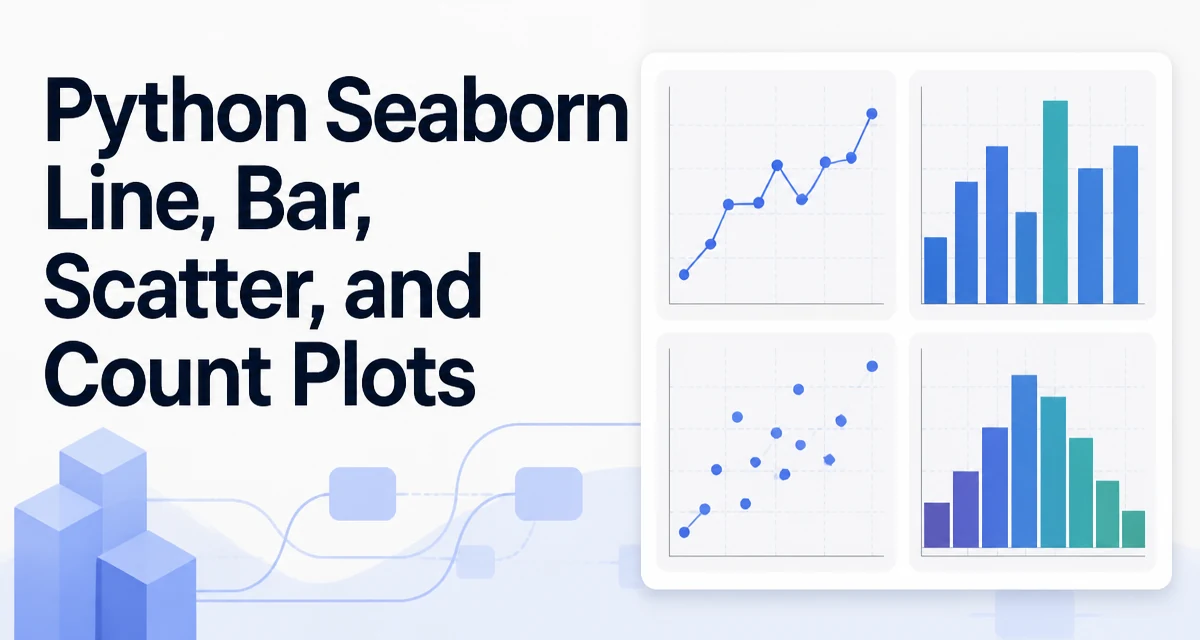
Python Seaborn Line, Bar, Scatter, and Count Plots
python seaborn line bar scatter and count plots: Learn to create line, bar, scatter, and count plots with seaborn, including syntax, parameters, and when to use each t...
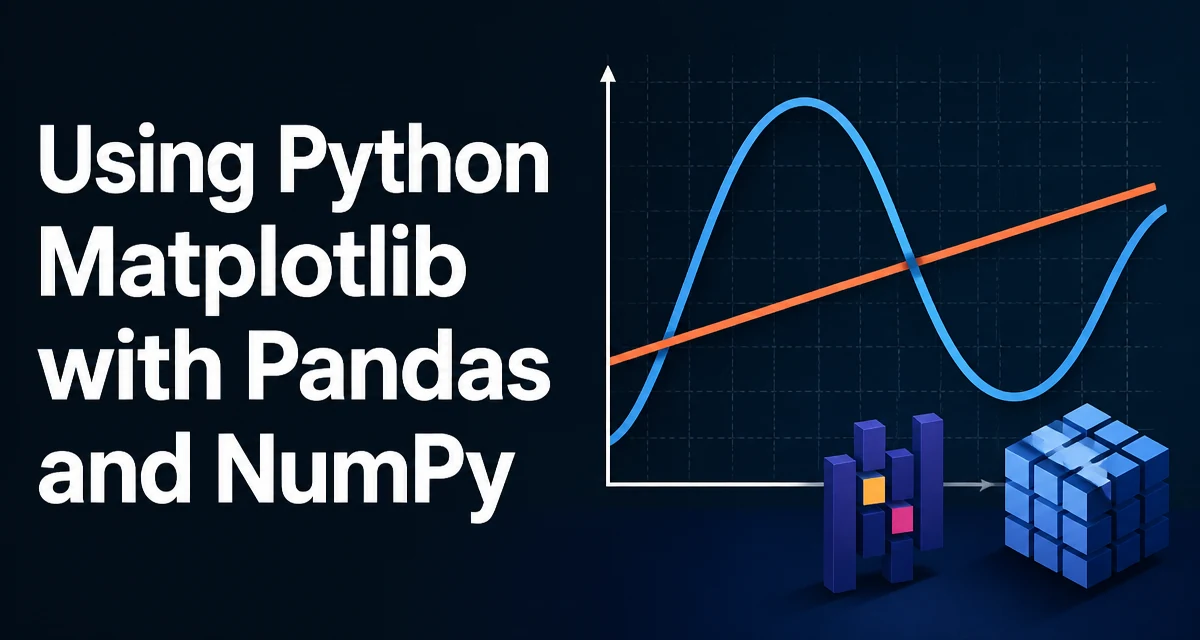
Using Python Matplotlib with Pandas and NumPy
python matplotlib with pandas and numpy: Learn how to combine matplotlib with pandas and numpy to create clean, customizable plots directly from DataFrames and arrays,...
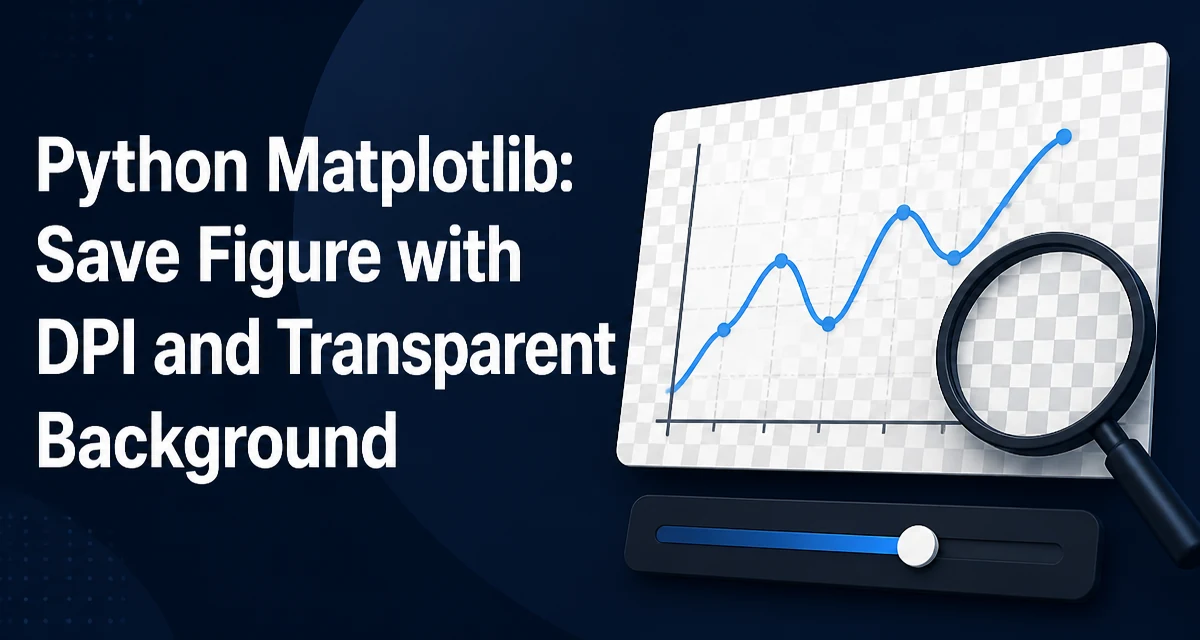
Python Matplotlib: Save Figure with DPI and Transparent Background
Learn how to control resolution and background transparency when saving Matplotlib figures. This guide covers savefig's dpi and transparent parameters, examples, and common pitfalls.
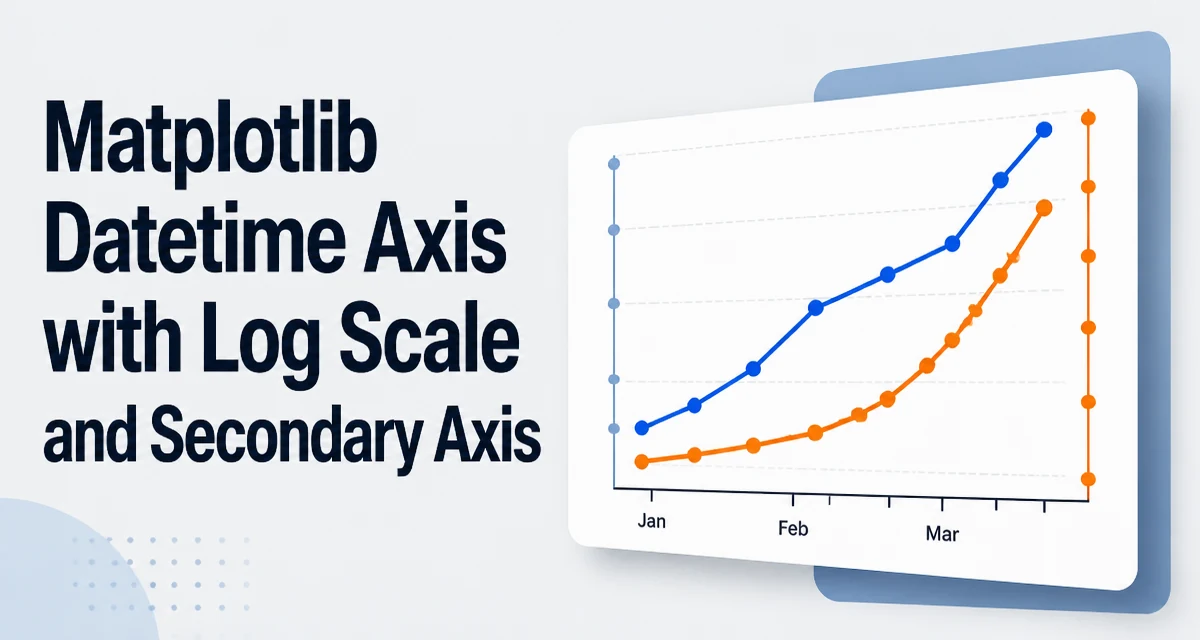
Matplotlib Datetime Axis with Log Scale and Secondary Axis
Convert Python datetimes to numeric values with `matplotlib.dates.date2num`, plot them on a log scale, and use a secondary axis for readable date labels. Includes examples for a secondary y-axis and common pitfalls.
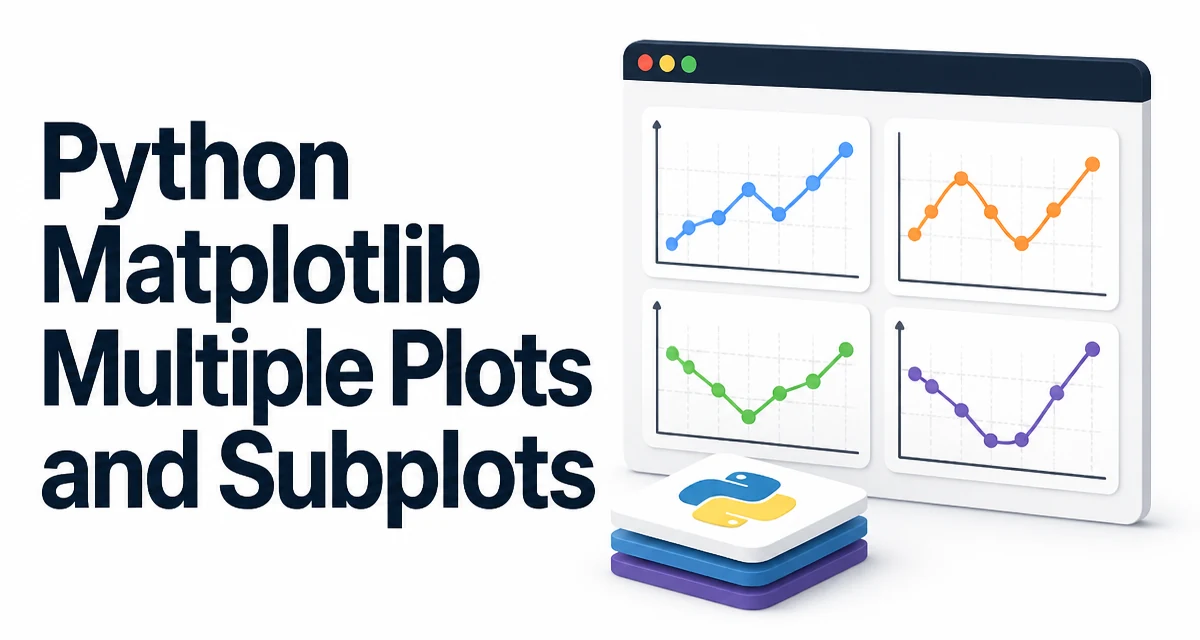
Python Matplotlib Multiple Plots and Subplots
python matplotlib multiple plots and subplots: Learn how to create multiple plots and subplots in Python Matplotlib using plt.subplots(), manage figure layout, share a...
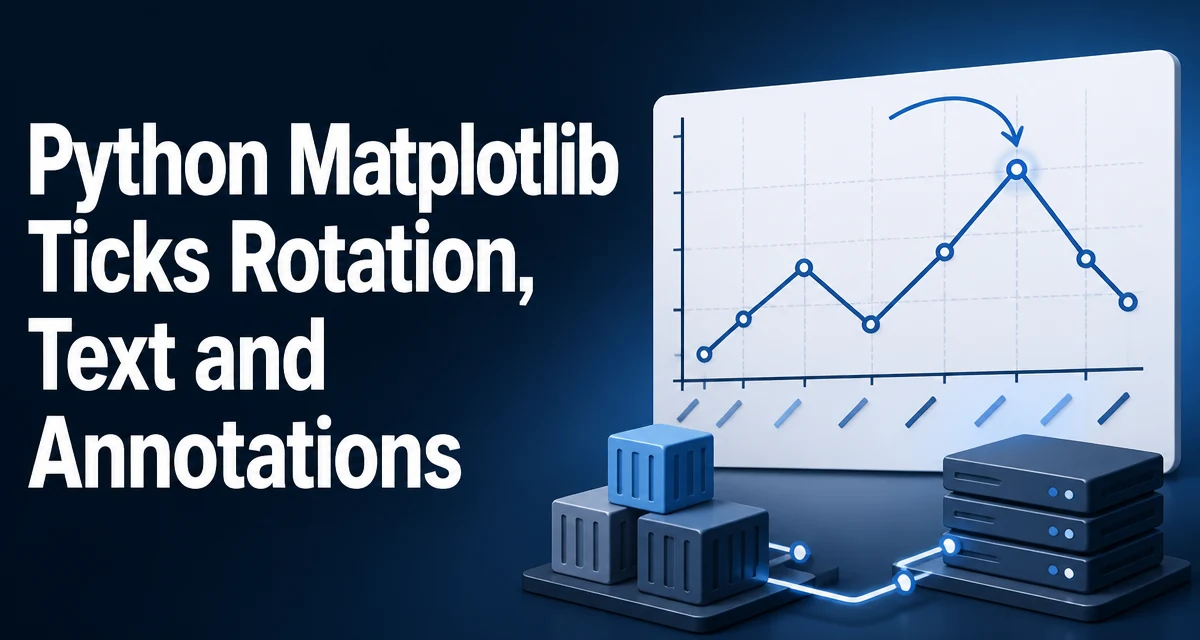
Python Matplotlib: Tick Label Rotation, Text, and Annotations
Rotate Matplotlib tick labels with tick_params, set explicit tick positions, and add text or arrow annotations with ax.text() and ax.annotate().
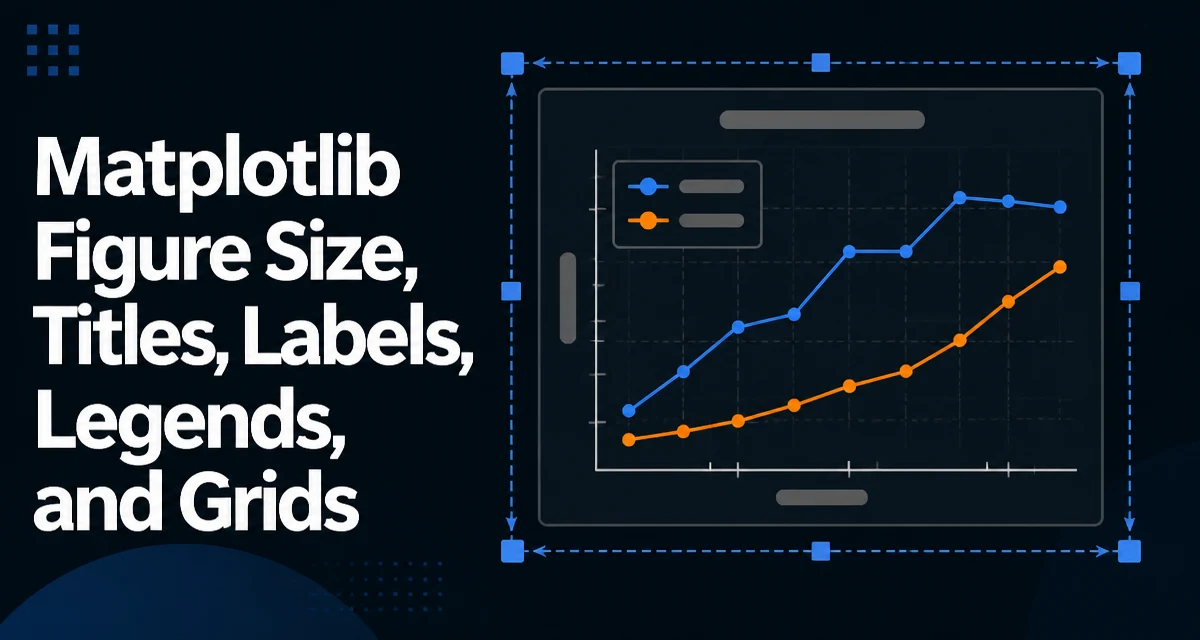
Matplotlib Figure Size, Titles, Labels, Legends, and Grids
Learn how to control Matplotlib figure size, titles, axis labels, legends, and grids in Python. Includes practical code examples and layout guidance.
Python Matplotlib Box Plot, Heatmap, and Statistical Charts
Learn to create box plots, heatmaps, and statistical charts with Python's Matplotlib. Practical code examples cover customization, annotations, and performance for larger datasets.
Python Matplotlib: Line, Bar, Scatter, Histogram, and Pie Charts
Learn how to create line, bar, scatter, histogram, and pie charts with Python Matplotlib, including code examples, customization options, and choosing the right chart type.