Horizontal Pod Autoscaler (HPA): Scaling Metrics and Stabilization Windows
The replica formula, its 10% tolerance, why utilization needs CPU requests, and the behavior policies that stop a scale loop from flapping. Plus the three causes of an unknown metric target.
Quick Summary
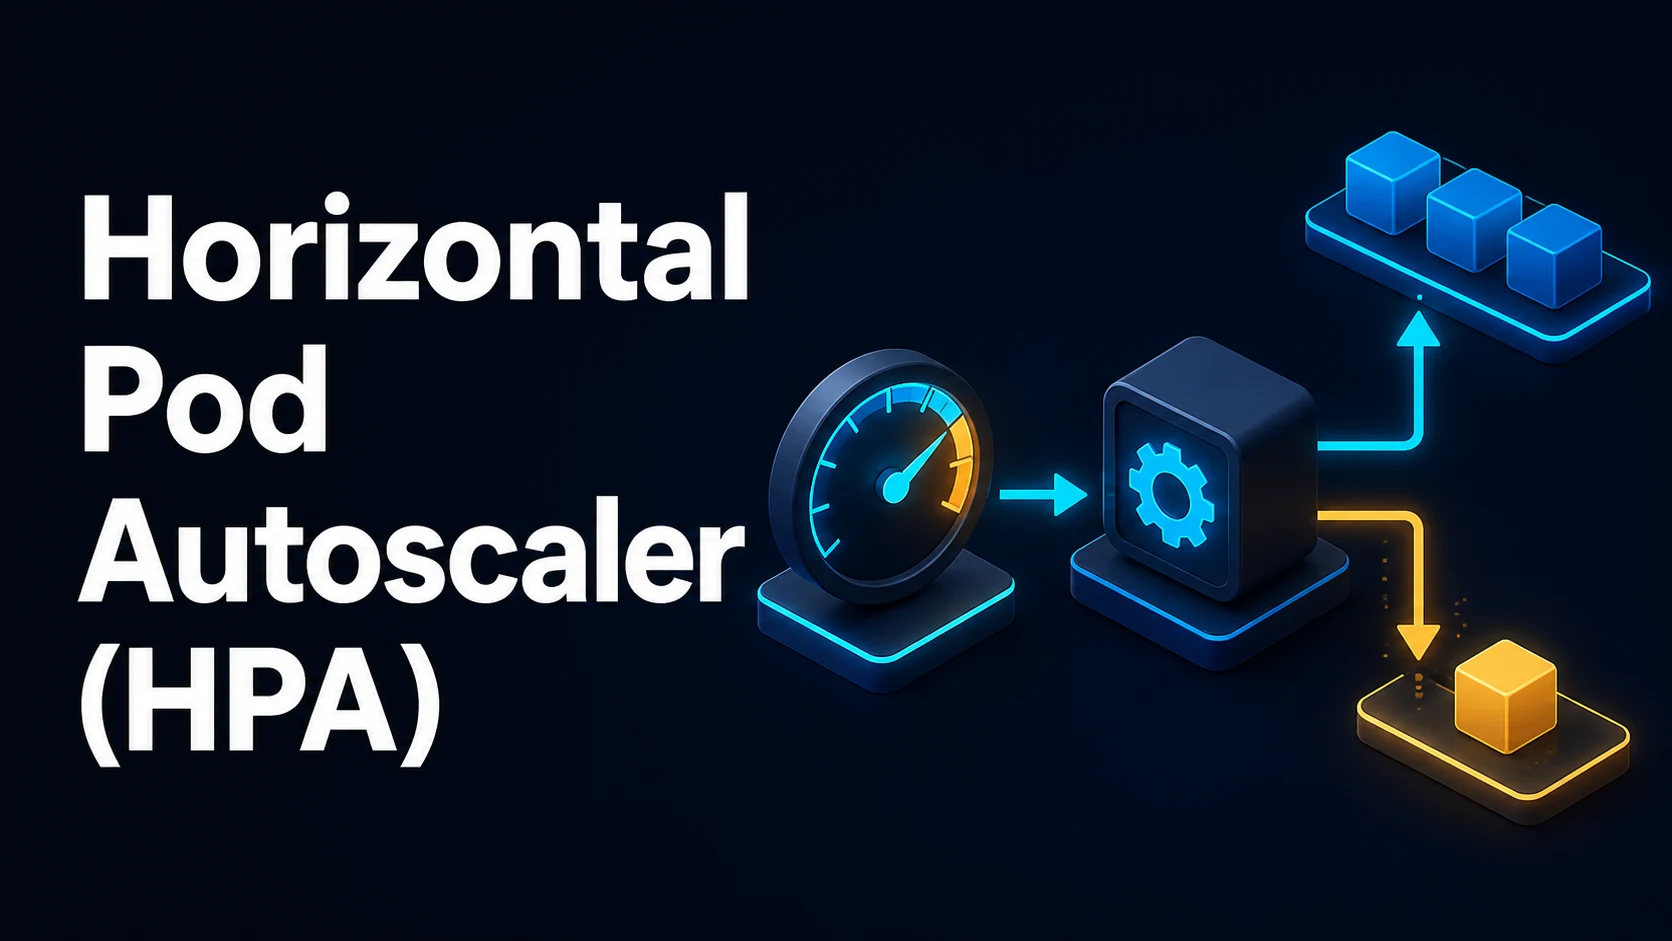
The HorizontalPodAutoscaler adjusts a workload's replica count from observed metrics. It is a control loop, not a scheduler feature: every 15 seconds (--horizontal-pod-autoscaler-sync-period) it reads the metrics API, computes desiredReplicas = ceil(currentReplicas × currentMetric / desiredMetric), applies a tolerance of 0.1 (a 10% deviation is ignored), and patches spec.replicas on the target.
For CPU and memory it reads the metrics-server, and the percentage is relative to the container's resources.requests — not the limit, and not the node. A Deployment without CPU requests cannot be autoscaled on CPU; the HPA reports <unknown>/50% and the event explains that the request is missing. Custom and external metrics come from a metrics adapter (Prometheus Adapter, KEDA), not from metrics-server.
Scaling is asymmetric by default: scale-up has no stabilization window and adds up to 4 pods or 100% every 15 seconds, while scale-down waits 300 seconds before acting and then removes at most 100% per 15 seconds. behavior changes both, and a stabilization window that is too short is the usual cause of flapping between two replica counts. This guide covers the autoscaling/v2 schema, the algorithm and its tolerance, behavior policies, the metrics pipeline, and the failure modes that leave an HPA showing <unknown>.
Basic Syntax & Core Signatures
apiVersion: autoscaling/v2
kind: HorizontalPodAutoscaler
metadata:
  name: api
spec:
  scaleTargetRef:
    apiVersion: apps/v1
    kind: Deployment
    name: api
  minReplicas: 3
  maxReplicas: 30
  metrics:
    - type: Resource
      resource:
        name: cpu
        target:
          type: Utilization          # average % of requests across ready pods
          averageUtilization: 65
    - type: Resource
      resource:
        name: memory
        target:
          type: AverageValue
          averageValue: 700Mi
  behavior:
    scaleUp:
      stabilizationWindowSeconds: 0
      policies:
        - type: Percent
          value: 100
          periodSeconds: 15
        - type: Pods
          value: 4
          periodSeconds: 15
      selectPolicy: Max              # Max | Min | Disabled
    scaleDown:
      stabilizationWindowSeconds: 300
      policies:
        - type: Percent
          value: 25
periodSeconds: 60# Container-level metric: ignores sidecars in the utilization calculation
metrics:
- type: ContainerResource
containerResource:
name: cpu
container: api
target: { type: Utilization, averageUtilization: 70 }kubectl get hpa
# NAME REFERENCE TARGETS MINPODS MAXPODS REPLICAS AGE
# api Deployment/api 62%/65%, 480Mi/700Mi 3 30 4 2d
kubectl describe hpa api
kubectl top pods -l app=api
kubectl get --raw /apis/metrics.k8s.io/v1beta1/namespaces/default/pods | head -c 400
kubectl get hpa api -o jsonpath='{range .status.conditions[*]}{.type}={.status} {.reason}{"\n"}{end}'# Required pieces, in order
kubectl -n kube-system get deploy metrics-server
kubectl top nodes # 404 => no metrics at all
kubectl get deployment api -o jsonpath='{.spec.template.spec.containers[0].resources.requests.cpu}'Key Comparison Table
| Metric type | Source | Target types | Notes |
|---|---|---|---|
Resource | metrics-server | Utilization, AverageValue | CPU and memory only |
ContainerResource | metrics-server | Utilization, AverageValue | Per container; stable 1.27 |
Pods | Custom metrics adapter | AverageValue | E.g. requests-per-second per pod |
Object | Adapter | Value, AverageValue | Metric on another object (Ingress) |
External | Adapter | Value, AverageValue | Queue depth, cloud metric |
| Behavior field | Default | Meaning |
|---|---|---|
scaleUp.stabilizationWindowSeconds | 0 | Look-back window when picking the highest recommendation |
scaleDown.stabilizationWindowSeconds | 300 | Look-back window before scaling down |
| Scale-up policies | max of +4 pods or +100% per 15s | Upper bound per step |
| Scale-down policy | -100% per 15s | Removes all at once after the window |
selectPolicy | Max on up, Max on down | Which policy applies when several do |
| Symptom | Meaning |
|---|---|
<unknown>/65% | Metrics unavailable, or requests missing |
failed to get cpu utilization: missing request for cpu | No resources.requests.cpu |
| Replicas ping-pong between two values | Stabilization window too short |
| Scales up at 3am with no traffic | Metric measures something unrelated (memory leak, sidecar) |
HPA at maxReplicas and still overloaded | Capacity ceiling, or the metric is the wrong one |
Practical Edge Cases & Deep Dives
1. The algorithm and the 10% tolerance
currentReplicas = 4, current CPU = 90%, target = 60%
ratio = 90 / 60 = 1.5
desired = ceil(4 * 1.5) = 6

current CPU = 63%, target = 60%   -> ratio 1.05, within tolerance (1 ± 0.1) -> no change
The tolerance means an HPA hovering around its target does not act until usage is more than 10% away, and the recommendation must also be above minReplicas and below maxReplicas to take effect. Utilization is averaged over ready pods: pods that are not ready are excluded from the average (and from currentReplicas for the ratio), which is why a rollout can produce a temporary spike — the new pods are not ready yet, so the average is computed from fewer pods handling full traffic.
kubectl describe hpa api | grep -A3 Events
# New size: 6; reason: cpu resource utilization (percentage of request) above target
2. <unknown> targets and the three things that cause them
$ kubectl get hpa
NAME  REFERENCE        TARGETS           MINPODS MAXPODS REPLICAS
api   Deployment/api   <unknown>/65%     3       30      3
$ kubectl describe hpa api | tail -5
Warning  FailedGetResourceMetric  ...  unable to get metrics for resource cpu:
  no metrics returned from resource metrics API
Three causes in order of likelihood: metrics-server is not installed or not healthy, the container has no resources.requests.cpu (so utilization has no denominator), or the pod is too new — metrics-server scrapes on its own interval and a 30-second-old pod has no sample yet. kubectl top pods distinguishes the first from the second: if top works and the HPA still shows unknown, the requests are the problem.
kubectl -n kube-system logs deploy/metrics-server --tail=50
kubectl get apiservice v1beta1.metrics.k8s.io -o jsonpath='{.status.conditions}'
3. Flapping, and behavior policies that stop it
$ kubectl get hpa api -w
api   Deployment/api  82%/65%   3   30   3
api   Deployment/api  80%/65%   3   30   6
api   Deployment/api  40%/65%   3   30   6
api   Deployment/api  38%/65%   3   30   3     # 5 minutes later, then back up
Two mechanisms cause this: a workload whose load arrives in bursts shorter than the scaling response, and metrics that change faster than the pods warm up. The scale-down stabilization window is the main lever — it looks back over the window and picks the highest recommendation, so a 5-minute default already covers short dips; longer (10-15 minutes) is common for JVM services with slow start-up. Combine it with a readiness probe that only passes when the pod can serve, otherwise new replicas count as capacity while they are useless.
behavior:
  scaleDown:
    stabilizationWindowSeconds: 600
    policies: [{ type: Pods, value: 1, periodSeconds: 120 }]
4. HPA versus manual scaling, VPA, and KEDA
$ kubectl scale deploy/api --replicas=2
$ sleep 20; kubectl get deploy api -o jsonpath='{.spec.replicas}'
5                       # the HPA already reset it
The HPA owns spec.replicas for its target. Manual scaling is overwritten on the next sync, and a GitOps controller that enforces replicas: 3 will fight the HPA indefinitely. The correct pattern is to omit replicas from the manifest (or let the HPA manage it and configure your GitOps tool to ignore that field), and to change minReplicas/maxReplicas when a new floor is needed.
A VerticalPodAutoscaler changing CPU requests while an HPA targets CPU utilization makes the target move under the HPA — run VPA in Off/recommendation mode alongside HPA, or use VPA for memory and HPA for CPU only. KEDA extends this to event-driven sources (queue length, Kafka lag) and supports scaling to zero, which the HPA cannot do (minReplicas must be at least 1, or 0 only with the alpha feature gate).
5. The wrong metric: memory and CPU do not scale the same way
metrics:
  - type: Resource
    resource: { name: memory, target: { type: Utilization, averageUtilization: 70 } }
Memory utilization rarely falls when load does — heaps stay allocated, caches stay warm — so an HPA on memory scales up and then never scales down. CPU is a demand signal; memory is a capacity signal. For request-driven services the useful metrics are requests-per-second or queue depth from an adapter, with CPU as a fallback. Using memory as the HPA metric is reasonable when the workload's memory genuinely tracks concurrency (a per-connection buffer), and a bad idea for most language runtimes.
6. Autoscaling that cannot help: the bottleneck elsewhere
An HPA tripling replicas does nothing when the database connection pool is the limit, the pods are all on one node that is out of CPU, or the Service has no endpoints because readiness fails under load. Check in that order:
kubectl get hpa api                       # is it at maxReplicas?
kubectl get pods -l app=api -o wide       # are new pods Pending?
kubectl describe pod <pending>            # Insufficient cpu / memory
kubectl get endpointslices -l kubernetes.io/service-name=api   # are they in rotation?
Pending new pods are the most common: the cluster has no room, so the HPA's arithmetic succeeds and the workload does not grow. Cluster Autoscaler (or Karpenter) then has to add a node, which takes longer than the HPA's 15-second loop and is the reason a load spike shows a latency bump before capacity arrives.
Common Runtime & Configuration Mistakes
| Symptom | Cause | Fix |
|---|---|---|
<unknown>/65% | No metrics-server, no CPU requests, or too-new pod | Install metrics-server; set requests |
missing request for cpu | Utilization has no denominator | Add resources.requests.cpu |
| HPA does nothing despite high load | Ratio within 10% tolerance, or at maxReplicas | Check describe events and limits |
| Replicas reset after a manual scale | HPA owns spec.replicas | Change minReplicas instead |
| Replicas flap every few minutes | Short scale-down window, slow start | stabilizationWindowSeconds 600+ |
| Scales up but never down | Memory metric, or a leak | Use CPU/RPS; fix the leak |
| New pods never scheduled | Node capacity | Cluster Autoscaler, lower requests |
| HPA and GitOps fight | replicas in the manifest | Remove it; ignore the field |
| VPA and HPA conflict | Both change resources/replicas | VPA in recommendation mode |
| Scale to zero never happens | HPA minimum is 1 | KEDA, or accept a floor |
| Utilization spikes during rollouts | Unready pods excluded from the average | minReadySeconds, readiness quality |
| HPA works in one namespace only | Permissions or the target's apiVersion | Check scaleTargetRef |
An autoscaler is a formula over a metric, and every failure is a question about one of the three: is the metric arriving, does it measure the right thing, and does the cluster have room for the answer it computes? Confirm kubectl top, confirm the requests, and read the HPA's events — the line New size: N; reason: ... states exactly which metric drove which decision.
Try matching browser tools
All toolsSmall utilities that fit Kubernetes work — they run entirely in this browser tab, so nothing you paste leaves your device.
Related Kubernetes guides
All Kubernetes guideskubectl Output: jsonpath, custom-columns, and the Debugging Commands Worth Knowing
jsonpath for one value in a script, custom-columns for tables people read, and kubectl debug when the container has no shell. Includes the three quoting layers that break jsonpath.
Kubernetes Namespaces, ResourceQuotas, and LimitRanges
A namespace is only a boundary when quota and limit range make it one. Aggregate caps, per-pod defaults, the admission errors they produce, and namespaces stuck Terminating.
Kubernetes StatefulSets: Ordinal Identities, Headless Services, and PVC Lifecycle
Why each StatefulSet pod keeps a name, a DNS record, and its own PVC; how OrderedReady gates startup on readiness; and how partition-based updates canary a single quorum member.
Kubernetes securityContext, Capabilities, and Pod Security Standards
The five fields that remove most container escapes, which of them only exist at container level, and how the restricted profile enforces the same settings at admission.
More in Kubernetes
All Kubernetes guidesThe guides filed next to this one in Kubernetes, in library order.
- Kubernetes Deployments: Rolling Updates, Rollbacks, and maxUnavailable
- Kubernetes DaemonSets: Node Selectors, Taints, and Rolling Update Strategies
- Kubernetes Ingress: Path Types, Controller Annotations, and TLS Termination
- Kubernetes Jobs and CronJobs: Completions, Parallelism, Backoff, and Missed Schedules