Python guides
Every published Python guide, newest first, with practical examples you can copy into your own project.
3,965 guides across 14 topics
Topics
Popular Python guides
Most read
Latest Python guides
Page 44 of 179
Python SciPy vs NumPy: When to Use Which
Understand the relationship between NumPy and SciPy, what each library provides, and when to use which for numerical computing in Python.
Python SciPy Sparse Matrices and Linear Algebra
Learn how SciPy sparse matrices store only nonzero values, choose among CSR, CSC, COO, LIL, and DIA formats, and solve sparse linear systems and eigenvalue problems.
Python SciPy Signal Processing and FFT: Core Workflows
Use SciPy's FFT functions in Python to compute spectra, filter signals in the frequency domain, and reconstruct real-valued signals.
SciPy Integration, Interpolation, and ODE Solving in Python
Practical Python examples for SciPy numerical integration, interpolation, and ODE solving.
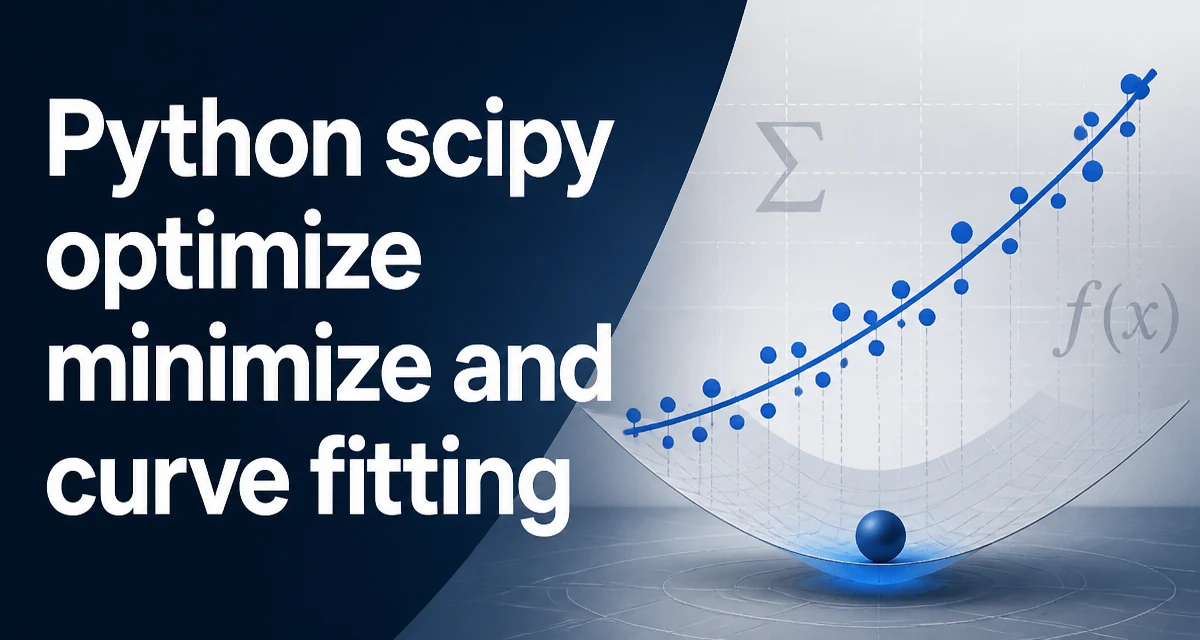
How to Use scipy.optimize.minimize and curve_fit in Python
Learn how to use scipy.optimize.minimize for general optimization and curve_fit for nonlinear least squares fitting, including bounds, constraints, and common pitfalls.
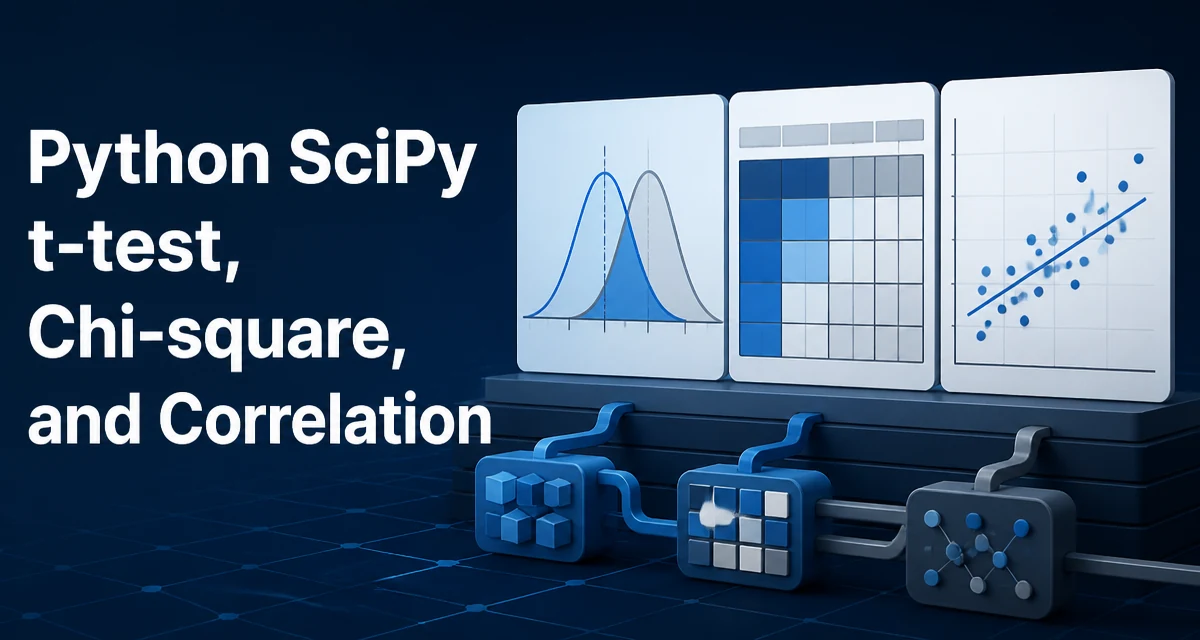
Python SciPy t-test, Chi-square, and Correlation
Learn how to perform t-tests, chi-square tests, and correlation analysis with scipy.stats, including code examples, assumptions, and practical guidance.
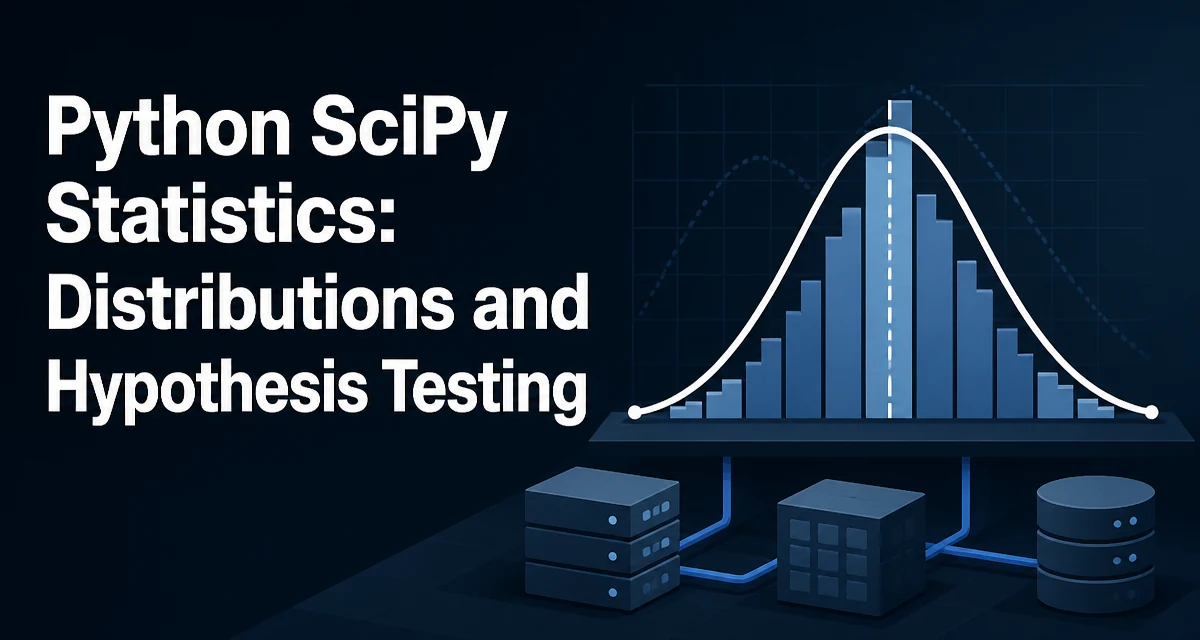
Python SciPy Statistics: Distributions and Hypothesis Testing
python scipy statistics distributions and hypothesis testing: Practical guide to using scipy.stats for probability distributions, distribution fitting, and hypothesis...
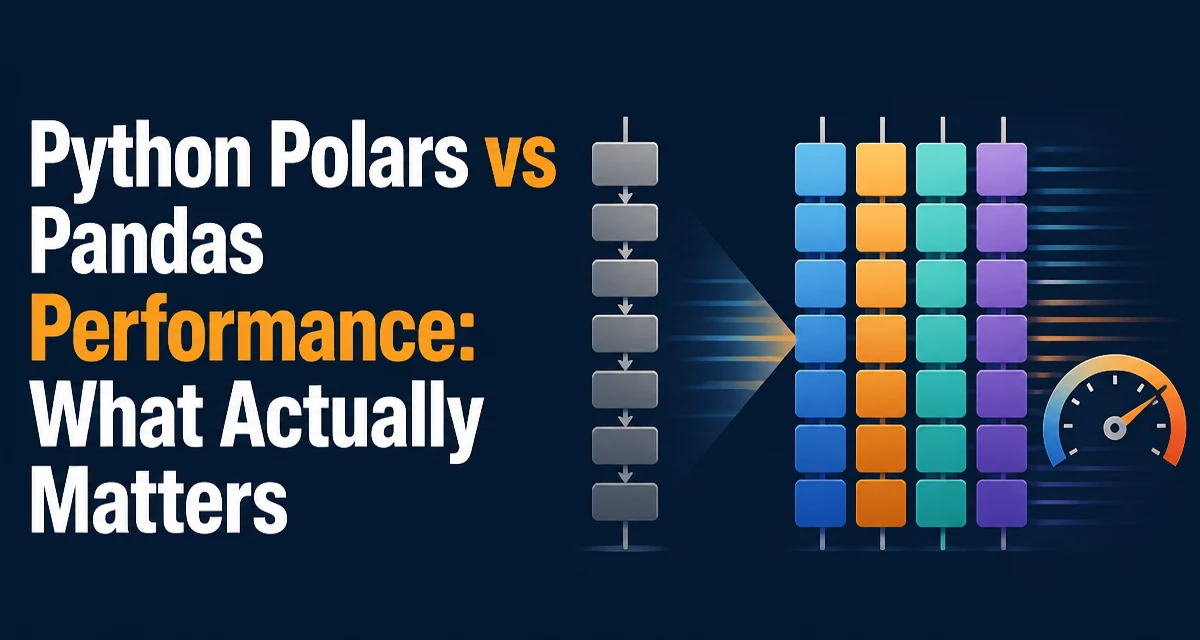
Python Polars vs Pandas Performance: What Actually Matters
Polars and pandas differ in execution, memory, and API design. Learn which DataFrame library fits your workload.
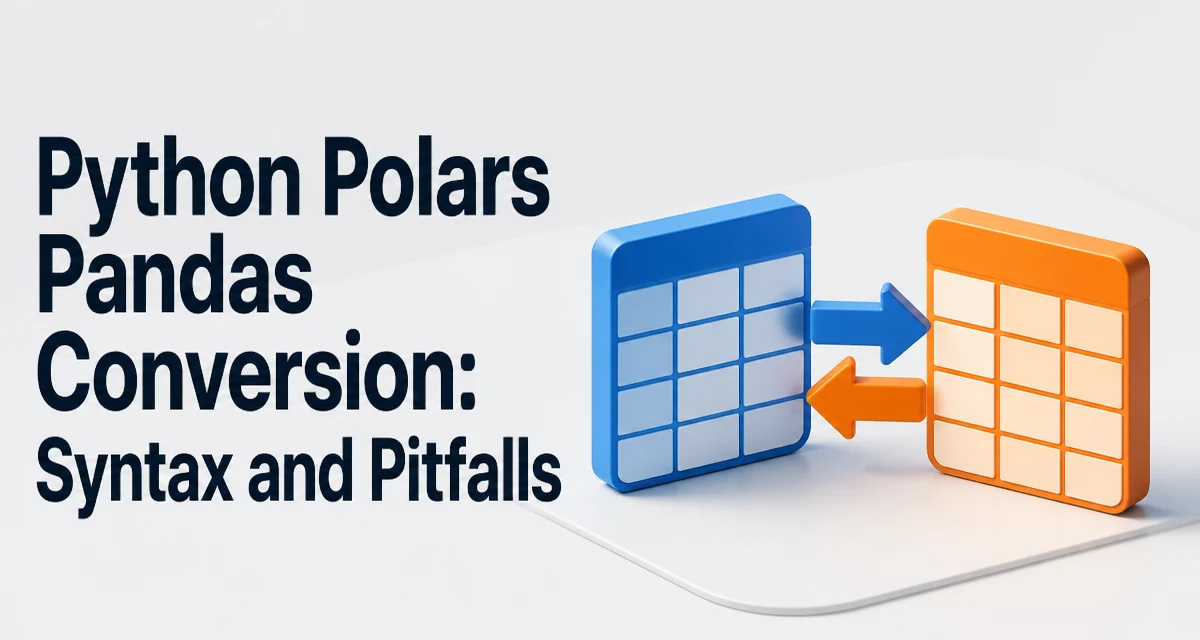
Converting Between pandas and Polars in Python: Syntax and Pitfalls
Learn how to convert DataFrames between Polars and pandas in Python, including dtype mapping, index behavior, null handling, and performance tradeoffs.
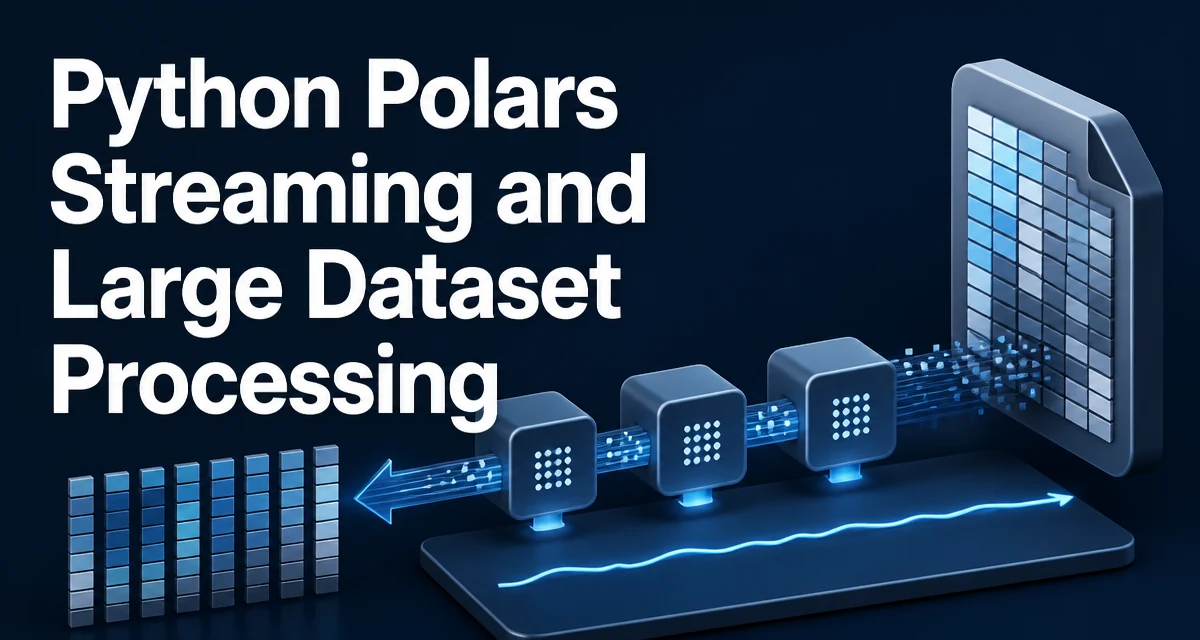
Python Polars Streaming and Large Dataset Processing
python polars streaming and large dataset processing: Learn how Polars' streaming engine processes datasets larger than available memory by working in batches, which o...