React Profiler API: Measuring Render Timings and Identifying Wasted Re-Renders
actualDuration versus baseDuration, phase names that tell you who triggered a commit, and how to ship the numbers without flooding a backend.
Quick Summary
<Profiler> measures how long a subtree takes to render and commit, and calls your onRender callback with real numbers for every commit that touches it. It is a React component, not a browser API, so the numbers are React's own timings: how long the render phase took for that subtree, how long the same subtree would have taken without memoisation, and when the commit began and ended relative to the page's start.
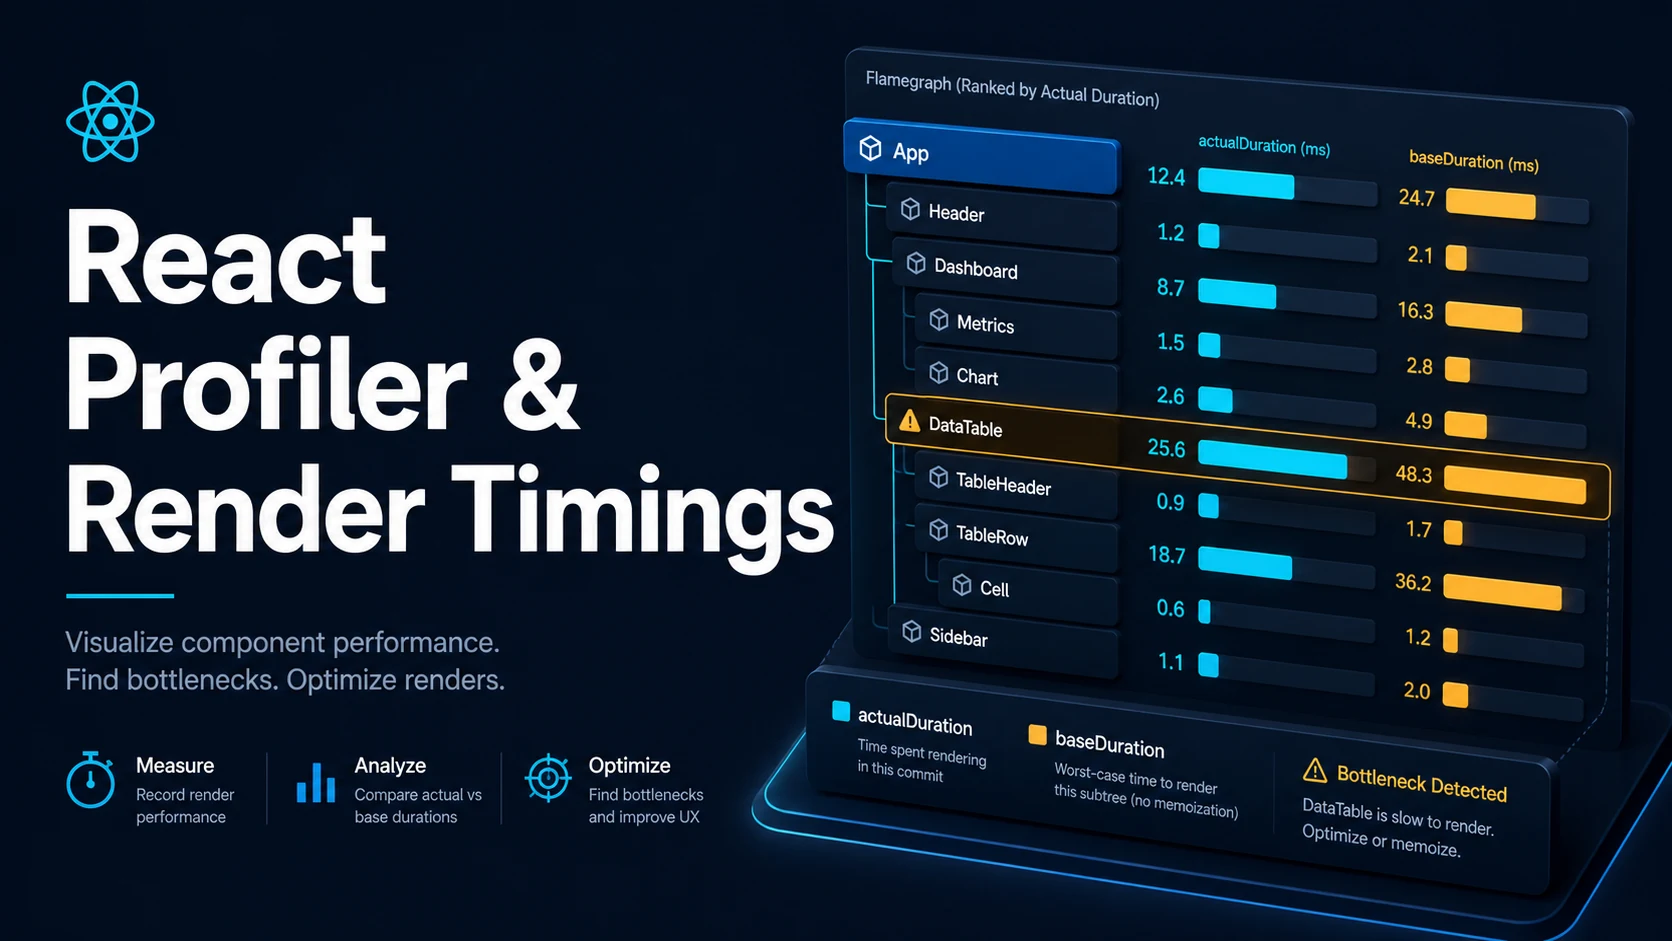
The two numbers that matter are actualDuration and baseDuration. actualDuration is what the commit cost. baseDuration is a worst-case estimate that re-renders every component in the subtree from scratch, ignoring memoisation for those components that mounted with memo. When actualDuration sits far below baseDuration, the memoisation is working. When they are close and large, either the memo is not in place or the update is touching everything anyway.
The Profiler tells you where the time goes per subtree; it does not tell you why a component rendered. For the why, React DevTools' "Highlight updates" and its own flame graph are faster. Shipping profiler data to a backend is the third option: the numbers are the only reliable way to know whether a change helped on a real device rather than on a developer laptop.
Basic Syntax & Signature
import { Profiler } from "react";

function onRender(
  id: string,                 // the Profiler's id prop
  phase: "mount" | "update" | "nested-update",
  actualDuration: number,     // ms spent rendering this subtree in this commit
  baseDuration: number,       // ms if every component rendered unaided
  startTime: number,          // when React began this commit
  commitTime: number          // when React committed this commit
) {
  console.log(id, phase, actualDuration.toFixed(1), baseDuration.toFixed(1));
}

export function App() {
  return (
    <Profiler id="dashboard" onRender={onRender}>
      <Dashboard />
    </Profiler>
  );
}
phase distinguishes the three commit kinds. mount is the first render of the subtree, update is a re-render caused by something inside the tree, and nested-update is a re-render caused by something above it — the distinction tells you whether a component is re-rendering on its own behalf or because a parent passed a new value.
Profiling wrappers can be nested, and each one reports its own subtree:
<Profiler id="page" onRender={onRender}>
  <Header />
  <Profiler id="feed" onRender={onRender}>
    <Feed />
  </Profiler>
  <Profiler id="sidebar" onRender={onRender}>
    <Sidebar />
  </Profiler>
</Profiler>
The parent's actualDuration includes its children's, so the leaf numbers are the ones to act on. Numbers are in milliseconds and come from performance.now() in the browser.
Key Comparison Table
| Tool | What it shows | Granularity | Runs in production |
|---|---|---|---|
<Profiler> + onRender | Render and commit duration per subtree | Component subtree | Yes, with a profiling build |
| React DevTools Profiler | Flame graph, ranked chart, why-did-this-render | Component | No, development only |
| DevTools "Highlight updates" | Every component that re-rendered | Component | No |
| Browser Performance panel | Main-thread tasks, layout, paint | Frame | Yes |
performance.measureUserTiming | Custom marks around an interaction | Whatever you mark | Yes |
console.time around a render | Wall clock, not React's accounting | Function | No |
Practical Edge Cases & Deep Dives
1. Sending timings to a backend without flooding it
const buffer: Array<{ id: string; ms: number; phase: string }> = [];

function onRender(id: string, phase: string, actualDuration: number) {
  // Ignore cheap commits: they are noise, not signal.
  if (actualDuration < 16) return;
  buffer.push({ id, phase, ms: Math.round(actualDuration) });
}

setInterval(() => {
  if (!buffer.length) return;
  const batch = buffer.splice(0, buffer.length);
  navigator.sendBeacon("/api/perf", JSON.stringify(batch)); // survives page unload
}, 10_000);
One request every ten seconds with the commits that exceed a frame budget is a useful signal. Sending every commit, including the 0.4 ms ones, costs more than it measures, and the profiler's own overhead starts to distort the numbers it reports.
2. Detecting a wasted re-render on a list
const Row = memo(function Row({ label }: { label: string }) {
  return <li>{label}</li>;
});

function List({ rows, query }: { rows: string[]; query: string }) {
  return (
    <Profiler id="list" onRender={(id, phase, actual, base) => {
      // base ≫ actual on updates means the memo is doing its job.
      console.debug(id, phase, { actual: actual.toFixed(2), base: base.toFixed(2) });
    }}>
      <ul>
        {rows.map((r) => <Row key={r} label={r} />)}
      </ul>
    </Profiler>
  );
}
If a search input re-renders this list and actualDuration is close to baseDuration, the memo is not helping: either rows is a new array each render, or Row is being matched by a key that changes. If actual is a fraction of base, the cost being reported is the parent passing new props, not the rows rendering.
3. Profiling with a callback identity that is stable
function StableProfiler({ children }: { children: React.ReactNode }) {
  // A new onRender function every render adds work to every commit.
  const onRender = useCallback((id: string, phase: string, actual: number) => {
    if (actual > 20) console.warn("slow commit", id, phase, actual);
  }, []);
  return <Profiler id="page" onRender={onRender}>{children}</Profiler>;
}
The profiler itself is cheap but not free: an inline arrow that closes over changing values is recreated on every render and forces the Profiler to update. Wrap the component once and keep the callback at module scope or behind useCallback.
4. Correlating a commit with a user interaction
function measure(label: string) {
  return {
    name: label,
    start: performance.now(),
  };
}

async function onClick(mark: { name: string; start: number }) {
  await new Promise((r) => requestAnimationFrame(() => r(null)));
  performance.measure(mark.name, { start: mark.start });
  const entry = performance.getEntriesByName(mark.name).at(-1);
  console.log(mark.name, entry?.duration.toFixed(1), "ms");
}

function SearchPage() {
  return (
    <Profiler
      id="search"
      onRender={(id, phase, actual, base, start, commit) => {
        // commit - start is the React commit span; actual is the render work.
        console.debug({ id, phase, render: actual.toFixed(1), span: (commit - start).toFixed(1) });
      }}
    >
      <Results />
    </Profiler>
  );
}
startTime and commitTime are relative to the page's timeOrigin, so subtracting them gives the commit span in the same units as performance.now(). That is how a profiler reading lines up with a browser trace when the question is whether React or the layout is responsible for a slow frame.
5. What the numbers look like when context changes
const ThemeContext = createContext<{ theme: string; toggle: () => void } | null>(null);

function Provider({ children }: { children: React.ReactNode }) {
  const [theme, setTheme] = useState("dark");
  // New object every render: every consumer re-renders, and the profiler shows it.
  return (
    <ThemeContext.Provider value={{ theme, toggle: () => setTheme((t) => (t === "dark" ? "light" : "dark")) }}>
      <Profiler id="consumers" onRender={(id, phase, actual, base) => {
        if (phase === "update") console.log("consumers", actual.toFixed(1), "of", base.toFixed(1));
      }}>
        {children}
      </Profiler>
    </ThemeContext.Provider>
  );
}
A consumer that reads only theme still re-renders when toggle changes identity, because the context value object changed. The profiler reports the whole consumer subtree as nested-update work on every parent render, which is exactly the signature of an unstable provider value. Memoising the value, or splitting the contexts, drops the number.
6. Production profiling build
// package.json (Create React App / webpack setups using React's profiling build)
{
  "scripts": {
    "build:profile": "react-scripts build --profile"
  }
}
React's regular production bundle strips the profiler's bookkeeping. A profiling build keeps it with a smaller overhead than the development build, which is the only way to get numbers that resemble a real user's. Development numbers are inflated by StrictMode's double render, source maps, and the absence of minification; optimising against them is optimising against the wrong workload.
Common Compilation/Runtime Mistakes
| Symptom | Cause | Fix |
|---|---|---|
onRender fires on every keystroke | Wrapping a subtree that genuinely re-renders | Narrow the Profiler's scope |
| Numbers far larger than production | Development build and StrictMode | Use the profiling build |
baseDuration is 0 | Subtree has no components that mounted with work | Not an error on trivial trees |
actualDuration never drops after memoisation | Parent passes new props or new callbacks | Stabilise props; check context values |
nested-update everywhere | A parent outside the Profiler re-renders | Move the boundary up or fix the parent |
| Overhead visible in traces | Heavy work in onRender | Buffer and flush off the hot path |
Profiler inside a list without a key | Array children need keys | Add a stable key |
| Production shows no data | Profiler code stripped in production builds | Profiling build or DevTools only |
| Numbers differ between runs | CPU throttling and background tabs | Profile with throttling on a quiet machine |
Read the output as a budget, not a score. A commit that takes 4 ms on a desktop is roughly 16 ms on a mid-range phone, and the only comparison that matters is between two versions of the same screen on the same device. The profiler's value is that it makes that comparison repeatable, per subtree, without guessing from a flame graph's width.
Try matching browser tools
All toolsSmall utilities that fit React work — they run entirely in this browser tab, so nothing you paste leaves your device.
Related React guides
All React guidesReact with TypeScript: Generic Components, PropsWithChildren, and Event Types
Generic props that infer from data, PropsWithChildren instead of React.FC, and element-scoped event types that keep currentTarget typed.
React useTransition and useDeferredValue: Non-Blocking Concurrent UI Updates
Transitions let React throw away background work when typing arrives. Which hook defers what, and why a controlled input must never be transitioned.
React.lazy and Code Splitting: Route Chunks, Preloading, and Suspense
Where the split points belong, how to preload on intent, and how to recover when a stale chunk 404s after a deployment.
React useLayoutEffect vs useEffect: Synchronous DOM Measurements and Flicker Fixes
One hook runs before the browser paints and one after. Measuring layout in the wrong one costs a visible frame of flicker on every mount.
More in React
All React guidesThe guides filed next to this one in React, in library order.